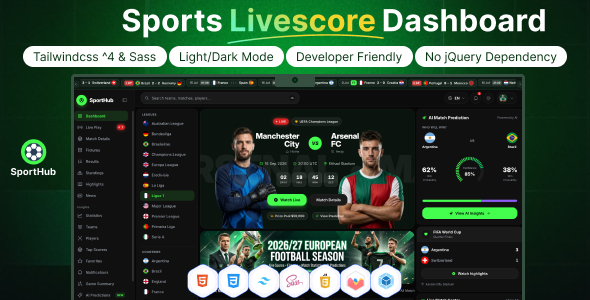
SportHub – Sports Live Score & Analytics Dashboard HTML Template is a modern and data-focused website template designed for sports analytics platforms, live score websites, sports news portals, match statistics services, tournament dashboards, and sports data management interfaces. With a dashboard-oriented design and an HTML-based front-end structure, SportHub provides a starting point for presenting match information, displaying performance statistics, organizing competition data, and creating an engaging sports analytics experience.
Whether you are developing a live sports score website, a match analysis platform, a sports data dashboard, or an interface for monitoring team and player performance, SportHub can help you establish a professional online presence. Its sports-focused concept makes it suitable for projects that need to present numerical information, match summaries, statistical comparisons, and competition-related content in an organized format.
As an HTML template, SportHub provides a front-end foundation that developers can customize using the technologies included in the supplied package. It can serve as a starting point for a sports analytics interface without requiring every visual component to be designed from scratch.
Sports fans, analysts, coaches, and data enthusiasts often need quick access to match results, team statistics, player information, and competition updates. A well-organized dashboard helps users find important information without navigating through a confusing interface.
SportHub is intended for sports-related dashboards where structured information and visual presentation are important. Its design can be adapted to different sports applications, from football scoreboards and cricket statistics to basketball analytics, tennis results, and multi-sport reporting platforms.
A customized interface may combine score summaries, match cards, statistical panels, tables, and chart-based information, depending on the components supplied with the template.
The visual style can also be tailored to suit your audience. A professional analytics platform may prioritize dense statistical information, while a fan-oriented sports website may emphasize team branding, match highlights, and easy-to-read score displays.
Live score information is a central feature of many sports platforms. Users want to see the current state of a match, identify participating teams, and understand the competition context quickly.
SportHub can provide a visual foundation for displaying scorecards, match summaries, scheduled fixtures, completed games, and other sports-related information where suitable layouts are included or developed.
A match card might display team names, logos, scores, match status, and competition information. Additional details could include the match date, venue, current period, or other sport-specific information.
For example, a football dashboard may show goals and match time, while a cricket dashboard may display runs, wickets, overs, and innings information.
It is important to distinguish between displaying score information and retrieving live scores. An HTML template does not automatically connect to live sports data providers. Real-time updates require a suitable API, data feed, backend service, or other supported integration.
Sports analytics platforms rely on accurate data to help users understand team performance, player contributions, and match trends. SportHub can be customized to present statistical information through tables, cards, and other visual components supported by the template.
Potential statistical categories include:
The specific metrics should reflect the sport and the data available from your chosen source.
For example, a football analytics platform may compare possession, shots, passes, and goals, while a cricket dashboard may present batting averages, bowling figures, strike rates, and run rates.
A well-designed dashboard should prioritize the statistics that matter most to its intended users. Too many unrelated metrics can make the interface difficult to understand.
Charts can help users recognize patterns that may be difficult to interpret from raw numbers alone. If the supplied SportHub package includes chart components, they can be customized to display relevant sports data. Additional chart libraries may also be integrated if needed.
Potential visualizations include line charts for performance trends, bar charts for team comparisons, and other appropriate graphs for statistical analysis.
For example, a dashboard could compare team performance across several matches, show scoring trends over time, or visualize selected player statistics throughout a tournament.
Every visualization should include clear labels, appropriate units, and meaningful legends. Where applicable, users should be able to distinguish between different teams, players, or time periods.
Actual charts require real data and suitable chart configuration. Static sample charts should be replaced with accurate values before the platform is used for analysis or public reporting.
A sports dashboard often needs to present upcoming fixtures alongside completed matches. SportHub can be adapted to organize competition information into clear sections that help users identify relevant games.
A fixtures section may include team names, match dates, scheduled start times, tournament details, and links to match pages. Results sections can display completed scores and other available match information.
You may organize fixtures by date, league, tournament, or sport, depending on the scope of the website.
For larger platforms, filtering and sorting can help visitors narrow down the displayed matches. For example, users may want to view a particular league, a specific team’s upcoming fixtures, or results from a selected date.
These interactions require appropriate implementation and a reliable source of fixture and result data. The template provides the front-end starting point rather than an automatically maintained sports database.
Team and player profiles can provide a more detailed view of sports performance beyond the main scoreboard.
SportHub can be customized to present relevant information about teams, athletes, and competitions, depending on the available layouts and data model.
A team profile may include its name, logo, competition, recent results, and selected statistics. A player profile might include the player’s position, appearances, scoring records, and other sport-specific metrics.
For cricket, player statistics could include runs, wickets, averages, and strike rates. For football, the relevant information may include goals, assists, appearances, and defensive contributions.
Use accurate data and explain statistical definitions when needed. Historical figures and current-season statistics should be clearly distinguished so that users understand the context.
Dynamic team and player profiles require a data source and suitable page or API integration.
League tables and tournament standings help users understand the position of teams within a competition. If suitable table components are included or developed, SportHub can be customized to present rankings and performance summaries.
A standings table may display team names, matches played, wins, draws, losses, points, and goal difference for a football competition. Other sports require different ranking criteria.
For tournaments, additional views may include group standings, knockout fixtures, qualification status, and completed results.
Clear column labels and consistent formatting are important, particularly when tables contain many teams or statistical fields. On smaller screens, consider responsive tables, horizontal scrolling, or a simplified mobile presentation.
Standings should be calculated from reliable results and follow the rules of the relevant competition. The template does not automatically calculate rankings unless that functionality is separately implemented.
Although a sports analytics dashboard may initially focus on one sport, the front-end can potentially be adapted to support different sports categories.
A multi-sport platform might organize content into football, cricket, basketball, tennis, volleyball, and other competitions. Each sport can have its own relevant score format, statistics, and match presentation.
The design should account for differences in how sports are scored and analyzed. A generic score card may work across several sports, but detailed statistics often need sport-specific layouts.
Developers can customize labels, data tables, score summaries, and visualization components to match the requirements of each sport.
The ability to support multiple sports depends on the data model, API integration, and custom development. It should not be assumed that every sport or competition is supported automatically by the template.
Sports fans frequently check scores and match updates on smartphones, tablets, and desktop computers. A responsive dashboard helps ensure that essential information remains accessible across different screen sizes.
SportHub should be tested using the actual template files and customized content to verify the behavior of its navigation, scorecards, tables, charts, and statistical panels.
On smaller screens, important scores and match status indicators should remain readable. Wide statistical tables may require horizontal scrolling or an alternative mobile layout, while chart components should resize without losing essential information.
Buttons, filters, and navigation controls should also be easy to use on touchscreens.
Responsive behavior depends on the supplied HTML, CSS, JavaScript, and any additional libraries or modifications. Test the completed website across common browsers and devices before deployment.
A sports analytics platform should have a consistent visual identity that reflects its audience and purpose. SportHub can be customized to match the branding requirements of a sports website, analytics service, media company, or competition management project.
Potential customization areas include:
A fan-focused website may use bold sports imagery and team colors, while a professional analytics interface may prefer a restrained design that emphasizes readability and numerical clarity.
The exact customization process depends on the files and dependencies included in the supplied package.
As an HTML dashboard template, SportHub provides a front-end structure that developers can inspect and modify. HTML defines the page structure, CSS controls the presentation, and JavaScript can support client-side interactions where included or implemented.
This foundation can be useful for creating a sports dashboard that connects to external services or a custom backend.
Depending on the package, the project may include stylesheets, JavaScript files, icons, images, and third-party libraries. Developers should review the documentation to understand the required dependencies and setup process.
Features such as user accounts, personalized dashboards, saved teams, notifications, live score retrieval, and statistical calculations require additional implementation unless explicitly provided by the seller.
For a live score platform, reliable data integration is one of the most important technical considerations.
SportHub can serve as the presentation layer for a sports application that retrieves information from a suitable data provider. Depending on the selected provider and its API capabilities, the application may retrieve fixtures, match results, team information, player statistics, and live score updates.
A typical integration may involve retrieving data from a sports API, validating and transforming the response, and displaying the resulting information in the dashboard.
For more complex applications, a backend service can manage API credentials, caching, scheduled updates, data normalization, and rate limits. Keeping sensitive API credentials on the server rather than exposing private keys in browser-side JavaScript is an important security practice.
The availability, accuracy, refresh frequency, and cost of sports data depend on the selected provider and its licensing terms.
The HTML template itself does not guarantee live data connectivity. API access, backend logic, and update behavior must be implemented and tested separately.
Search engine optimization can help users discover sports content, match reports, competition pages, and statistical information through relevant searches.
When customizing SportHub, use descriptive page titles, clear headings, meaningful text, and appropriate metadata for public-facing pages. Individual competition pages, team profiles, and match reports can provide useful context beyond numerical score displays.
For example, a sports website may publish match summaries, team performance reports, tournament previews, and historical statistical comparisons.
Use original content and ensure that the information is accurate and timely. If your platform relies heavily on dynamically loaded data, verify that important public content can be accessed and understood by search engines.
The template alone does not guarantee rankings. Search visibility depends on content quality, technical implementation, site performance, competition, and other SEO factors.
Sports websites may need to update information frequently and display large amounts of structured data. A smooth user experience depends on efficient front-end rendering, optimized assets, and sensible data retrieval.
SportHub’s final performance will depend on the supplied code, image assets, JavaScript libraries, hosting environment, and external data integrations.
To improve performance, optimize team logos and other images, remove unnecessary scripts, and avoid repeatedly requesting identical data when caching is appropriate.
For live dashboards, use an update strategy that matches the requirements and limitations of the data provider. Excessive polling can increase server load and consume API quotas without improving the user experience meaningfully.
Test the website with realistic data volumes and check that charts, tables, and match cards remain responsive during updates.
SportHub can be adapted for several sports-related projects, depending on the components included in the template.
Live Score Websites: Present match scores, fixtures, and results when connected to a suitable data source.
Sports Analytics Platforms: Display team performance metrics, player statistics, and comparative visualizations.
Sports News Portals: Provide a dashboard-style presentation for match information and competition updates.
Tournament Websites: Organize fixtures, results, rankings, and competition-related content.
Fantasy Sports Interfaces: Create a front-end foundation for presenting relevant player statistics and match information, subject to the platform’s additional requirements.
Sports Data Services: Present statistical information through tables, cards, and chart-based dashboards.
Sports Media Companies: Develop a branded interface for reporting sports information and analysis.
Web Development Agencies: Use the template as a starting point for sports-related client projects.
The suitability of each use case depends on the actual template package and the functionality developed around it.
SportHub provides a starting point for developers and businesses building sports data interfaces.
Potential benefits include:
The actual features included in the package should be verified through the seller’s official documentation and demo.
Setting up SportHub generally involves downloading the template package, reviewing its documentation, customizing the front-end files, and deploying the website to a compatible hosting environment.
A typical setup process includes:
The exact installation procedure depends on the included files and libraries. Follow the seller’s documentation for any required dependencies or build tools.
SportHub is a potential choice for developers who want a sports-focused interface for presenting scores, statistics, fixtures, and competition information. Its dashboard-oriented purpose can provide a useful foundation for organizing sports data and creating a professional browsing experience.
It may be particularly useful for projects that need to combine match information with analytical views, allowing visitors to explore scores and performance metrics within a consistent interface.
For the best results, pair the template with a reliable sports data provider, accurate statistical processing, clear visualizations, and responsive layouts. Before purchasing, review the official demo, included components, dependencies, and supported technologies to confirm that the package meets your project’s requirements.
SportHub – Sports Live Score & Analytics Dashboard HTML Template provides a front-end starting point for building sports score websites, analytics dashboards, tournament interfaces, and sports data platforms. Its sports-focused design makes it suitable for presenting match information, performance statistics, fixtures, team profiles, and competition results in an organized format.
With thoughtful customization, reliable data integration, optimized assets, and careful testing, developers can adapt the template to create a useful sports information experience for fans, analysts, and other users.
Whether you are building a live score website or a sports analytics project, SportHub can serve as a foundation for front-end development. Review the seller’s official specifications and demo before purchasing, particularly if your project requires real-time score updates, advanced filtering, or dynamic statistical calculations.
1. All digital products are the most recent version, with no possibility of free updates. After payment, you can request an update to the most recent version for 5 days if a new version is released. We free support within 5 days.
2. If a license is required (Excludes WHMCS license , we provide only method not license), please contact us via email or ticket for assistance with activation. Our license is only valid for activation and does not include support.
3. We provide Mobile, PHP script installation services for $19.90 / ₹1700. Please create a backup after installation as we do not support re-installation. For mobile app source code, we do not offer installation services.
4. If you have any questions, please contact us by email [email protected] or create a ticket on this page
5. Please note that any digital products presented on the website do not contain malicious code, viruses or advertising. You will receive the original files from the developers. We do not sell any products that have been downloaded from other websites.
6. The response time can last up to 6 hours.
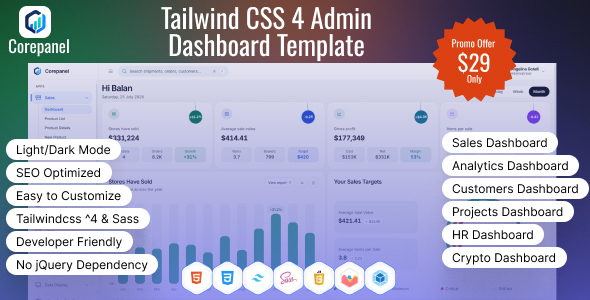
Corepanel – Tailwind CSS 4 Admin Dashboard Template Corepanel – Tailwind CSS 4 Admin Dashboard Template is a modern administrative dashboard template...
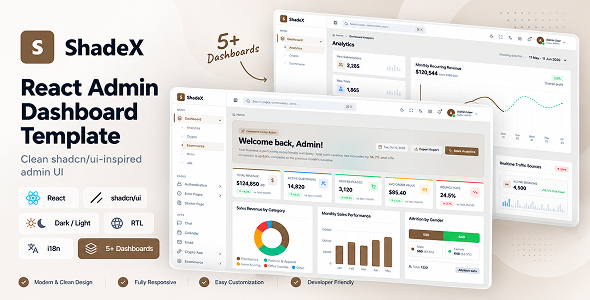
ShadeX – React Admin Dashboard Template with shadcn/ui, RTL & Dark Mode ShadeX – React Admin Dashboard Template with shadcn/ui, RTL &...
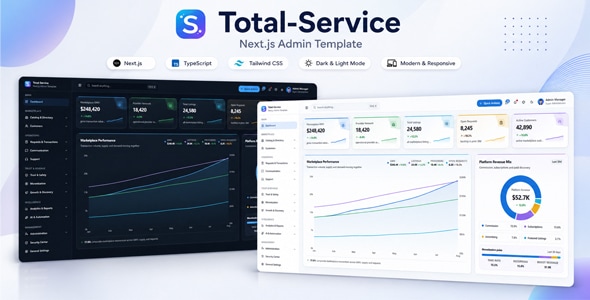
Total Service Next.js Admin Template Total Service Next.js Admin Template is a modern administrative dashboard template designed for developers, businesses, and service-based...

Orvexa | AI Operations HTML Admin Template Orvexa | AI Operations HTML Admin Template is a modern administrative dashboard template designed for...
